Calibration of Analogue Inputs and Outputs
Ideally, there is a direct, linear connection between the value of an analogue input or output of the Beacon and the corresponding value range of the connected sensor or actuator defined in the pump settings.
Using the example of a simple 0-16 bar pressure sensor on an analogue input of the Beacon, 0 bar measured in voltage mode corresponds to a signal value of 0 volts, 16 bar to a signal value of 10 volts and the range in between is directly proportional (i.e. 2.5V = 4 bar, 5V = 8 bar, 7.5V = 12 bar, etc.).
In reality, however, there is often a deviation, very often not only by an invariable amount over the entire measuring range, but with different magnitudes at the two ends of the range to be measured. For this reason, it may be necessary to calibrate an input/output.
Calibration can be achieved by adjusting the value range on which the signal of an analogue input or output is interpreted accordingly.
Two measurements (with a multimeter, for example) at points as far apart as possible in the entire value range are required to adjust the value range to reality in a meaningful way.
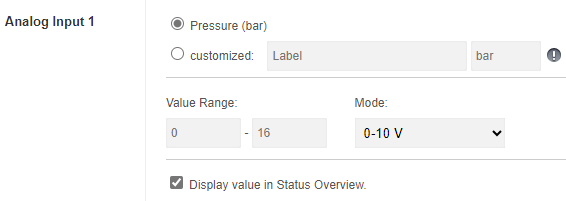
Example Pressure sensor 0-16 bar / 0-10 V:
Original setting in the portal:
Measurement of the transmitted values and corresponding sensor values:
|
|
|
|
In the next step, these empirically determined values must be inserted into the following formula and calculated for each measured value of 0 and 10 volts:
Measured Value - Min. Measured Value.
Sensor Value = ————————————————————————————————————————————————————————————————————————————————— + Min. Sensor Value
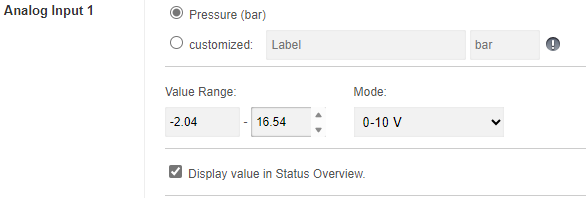
(Max. Measured Value - Min. Measured Value) × (Max. Sensor Value - Min. Sensor Value)The results of this calculation, from -2.04 bar for measured value = 0V or 16.64 bar for measured value = 10V, give the calibrated value range to be defined for the analogue input or output:
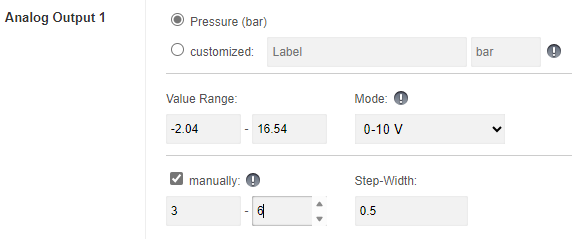
If this measurement/calibration relates to an analogue output, crooked (or simply nonsensical for the control system) values can be avoided in the manual selection by restricting the available value range using the new function. In the example case described, this would be 0 to 16 bar, alternatively further restricted to a range of 3 to 6 bar, for example, which can only actually be used:
No Comments